On March 21, 2018, Computrols Director of Research and Development, Mike Donlon, presented on the topic of “Optimal Virtual Metering In Building Automation” at the Globalcon Conference in Boston, MA. The below information is a transcribed excerpt from his session.
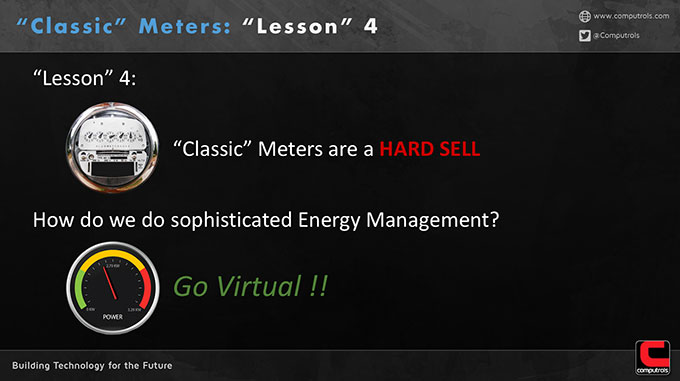
The final “lesson” here is classic meters are a hard sell. Meters do not save energy. They are simply a tool that leads to energy savings. So how do we do the sophisticated energy management techniques without all of the data that we need? That leaves virtual meters. A virtual meter is really just a calculation. You are taking what you know and you’re running it through a formula and you’re producing energy usage data.
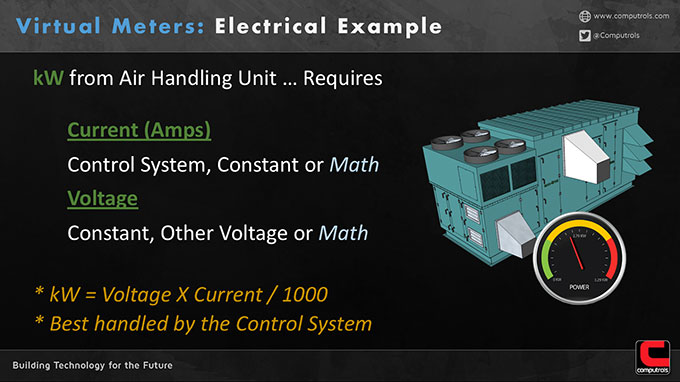
Let’s look at the example of kW from an Air Handling Unit (AHU). What do I need? I need current and I need voltage. If I have these two pieces of data, I can multiply them together and get the kW off of the unit. As an HVAC controls engineer, we have clients come to us all of the time and say, “I want to get a real status on the unit. I thought it was running the other day but it wasn’t. Put on a dry contact or a static pressure switch.” Well today, it’s silly to do anything other than add a current transducer. That way we know whether it’s on or off, how much energy it’s burning, and we might even be able to tell if the motor needs servicing by the amount of current it’s drawing.
Voltage might come right off of the name plate. We may just be able to call it 120 volts or we might be able to adjust that if we are measuring voltage somewhere else in the building. And the last one is Math, which we will cover a little bit at the end of the presentation. The point being, I don’t necessarily need to purchase a meter to know how much energy this AHU is using.
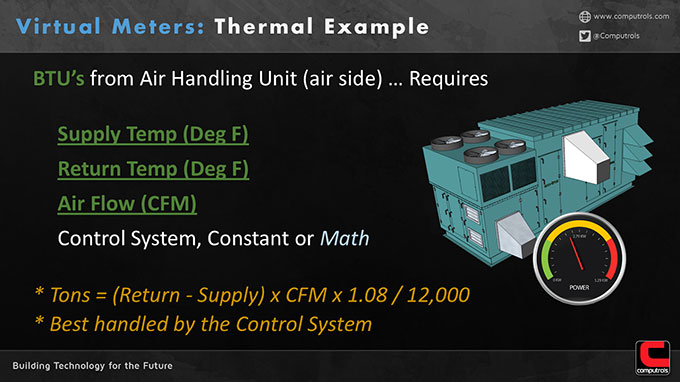
BTUs from an AHU…The previous slide was electrical energy. AHUs are unique in that they burn two types of energy: fan energy, right off of the electrical supply and thermal energy using water that is being made in the central plant. On the air side, I need three numbers. I need the supply temp, the return temp, and the air flow. In many HVAC situations, we have all of these numbers, we just never bothered to do the calculation, put it together, and supply that tonnage information to people who can use that for energy savings. And of course, we want it recorded historically, all the time, under different conditions…outside air, occupancy, etc.

It turns out that lighting is a lot easier. A light burns an exact amount of energy. It’s rated to burn it, so you can figure out what it is. The main other unit I have here is on/off. You don’t need to put actual, real meters on lighting circuits.
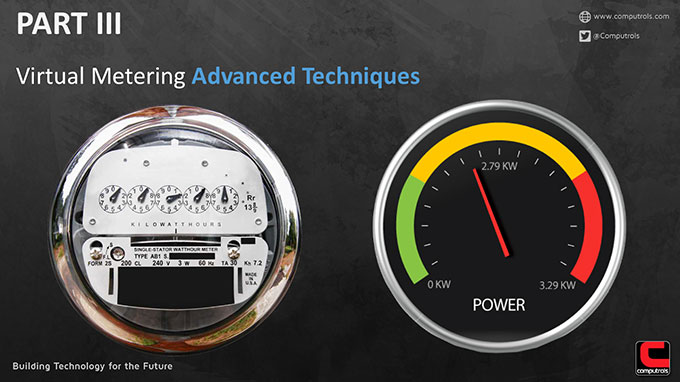
The advanced techniques that we have been talking about are a little bit beyond normal virtual metering. It’s all about the numbers you are missing. You take all of the input data you can get your hands on, take all of the relationships that you know, in machine learning we call it the hypothesis. It’s an equation that can tie things together if you feed it enough data and then finally we get the output which, in this case, would be energy information on every single thing that is being controlled within the building.
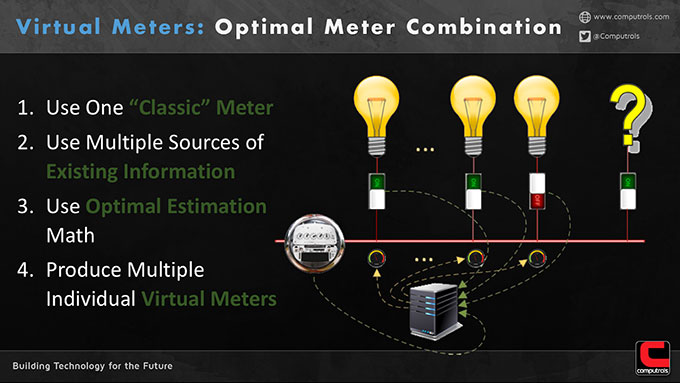
Here we have a drawing where we have a real meter and it’s connected to the electrical system. I have represented lighting circuits with a single light bulb but let’s just say one light bulb represents the lights in a given room, something that is switched on and off. There are many of these and I am not going to meter each one of the rooms but I already, because I am a controls system, turn these things on and off, and I am measuring the total consumption from all of it. So you don’t need to be a math genius to know that if I turned them all off and I left one of them on, I could just take the measurement which is easy to figure out. Unfortunately, you don’t always get to measure individual circuits. You can’t just turn things on and off to play with them to figure it out.
And then there is that question mark at the end. What is more realistic is that there are the 20 things I am controlling on this circuit and there are some things on this circuit that I don’t really know about like plug loads because we don’t have any real information on it. We are going to consider that noise in the system. Over time, if I am controlling the system, and I cycle things on and off and record it all and the whole time. I’m measuring the electrical consumption with one meter AND at the end of some period of time, I can figure out the electrical consumption of every one of them. And that is straight up machine learning.

The typical example is what we call linear regression. A simplified version is we just collect a bunch of data and you can start to see a pattern emerge here which is a straight line. They don’t all rely on a straight line. Remember the question mark from the previous slide. There is other noise being thrown at it, but if we get enough of it, we can just draw a straight line through it.
This particular graph is in two dimensions. Typically, modern machine learning works in much higher dimensions. For example, if I had 20 floors, I would be working in 20 dimensions. We couldn’t draw a picture of it but the math is pretty straightforward. It’s actually a little bit better than having a meter.
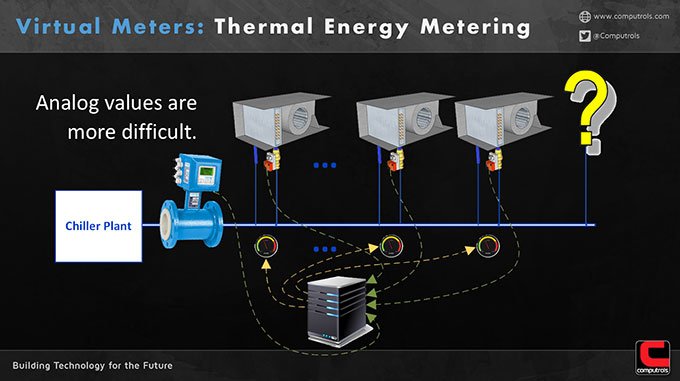
If I put a meter on every one of these AHUs, I would know its instantaneous value, but I have something that is more valuable now. I have a mathematical model of the whole thing. Not only can I tell you what it’s doing now, I can run a simulation and I can tell you what it would be doing under different conditions or if I were to run it differently. That is sort of the “Holy Grail” of all of this is to build math models.
This final example shows a flow meter that measures the tonnage delivered by the chiller plant and then we have control over each of the chill water valves on each one of the units. It’s the same type of thing. Overtime, we are going to get really good at saying, if that chill water valve is 75% open then I know the supply temperature coming out of the plant and the pressure in the pipe. I’ll eventually be able to figure out exactly how much BTU the unit is burning.
